

Investigation into vibrations in the M1M3 surrogate on the TMA due to the Fan Coil Units#
Abstract
This technical note analyzes data from the Vibration Monitoring System (VMS), dc accelerometers, and the Independent Measurement System (IMS) to assess how the operation of Fan Coil Units (FCUs) might impact image quality.
Introduction#
This technical note analyses data from the Vibration Monitoring System (VMS), dc accelerometers and Independant Measurement System (IMS) to assess how the operation of Fan Coil Units (FCUs) might impact image quality. Primarily we use the Vibration Monitoring System (VMS) attached to M1M3 (for more information see the VMS confluence page). The description of the FCU is avaiable in SPIE 77331E.
The VMS data are stored in a single hdf5 data file:
/sdf/data/rubin/shared/mtm1m3_test_files/vms_data/2023/12/M1M3-2023-12-07T00:00.hdf
acquired on 2023/12/07. A description of the data taking procedure with exact timing is available in a log file attached to the JIRA ticket SITCOM-1131 associated to this Technical Note. The timing of each data taking period corresponding to the various fan speeds expressed in percent of the maximum speed is deduced from the log file.
Times of events#
FCU state |
Start Time |
End Time |
|---|---|---|
0 |
2023-12-07 14:20:00.00 |
2023-12-07 14:30:00.00 |
10 |
2023-12-07 14:55:30.00 |
2023-12-07 14:59:55.00 |
20 |
2023-12-07 15:00:05.00 |
2023-12-07 15:04:00.00 |
30 |
2023-12-07 15:05:05.00 |
2023-12-07 15:10:00.00 |
40 |
2023-12-07 15:12:30.00 |
2023-12-07 15:14:30.00 |
50 |
2023-12-07 15:16:15.00 |
2023-12-07 15:20:00.00 |
60 |
2023-12-07 15:21:40.00 |
2023-12-07 15:25:00.00 |
70 |
2023-12-07 15:26:05.00 |
2023-12-07 15:30:00.00 |
80 |
2023-12-07 15:31:05.00 |
2023-12-07 15:40:00.00 |
90 |
2023-12-07 17:48:55.00 |
2023-12-07 17:50:10.00 |
100 |
2023-12-07 14:33:00.00 |
2023-12-07 14:45:00.00 |
100 |
2023-12-07 17:51:30.00 |
2023-12-07 17:53:00.00 |
Data quality#
We have checked that the TMA was not moving during this test (Azimuth: -25.95 deg - Elevation: 89.95 deg) and that the mirror was raised:
MTM1M3.logevent_detailedState == ACTIVEENGINEERING
with Hard Point in standby mode.
We also checked that the Force Balance System was turned off during the whole duration of the test.
The next test was to check the VMS accelerometers sampling rate which is supposed to be 200 Hz. To do so, we compute the time difference (delta t) between consecutive samples. In the following plot (left), we see that while most of the samples are separated by ~0.005s (200 Hz), some samples are separated by ~0.00444s. If we plot delta t as a function of the sample number (right plot) we see that this feature is periodic and could potentially impact the PSD analyses. This issue has been reported as a bug in the JIRA ticket DM-43219. Petr Kubanek pointed that the 200 Hz sampling rate is fixed by the hardware, so the observed behavior is probably due to a wrong timestamp recording and will not affect the PSD analyses.
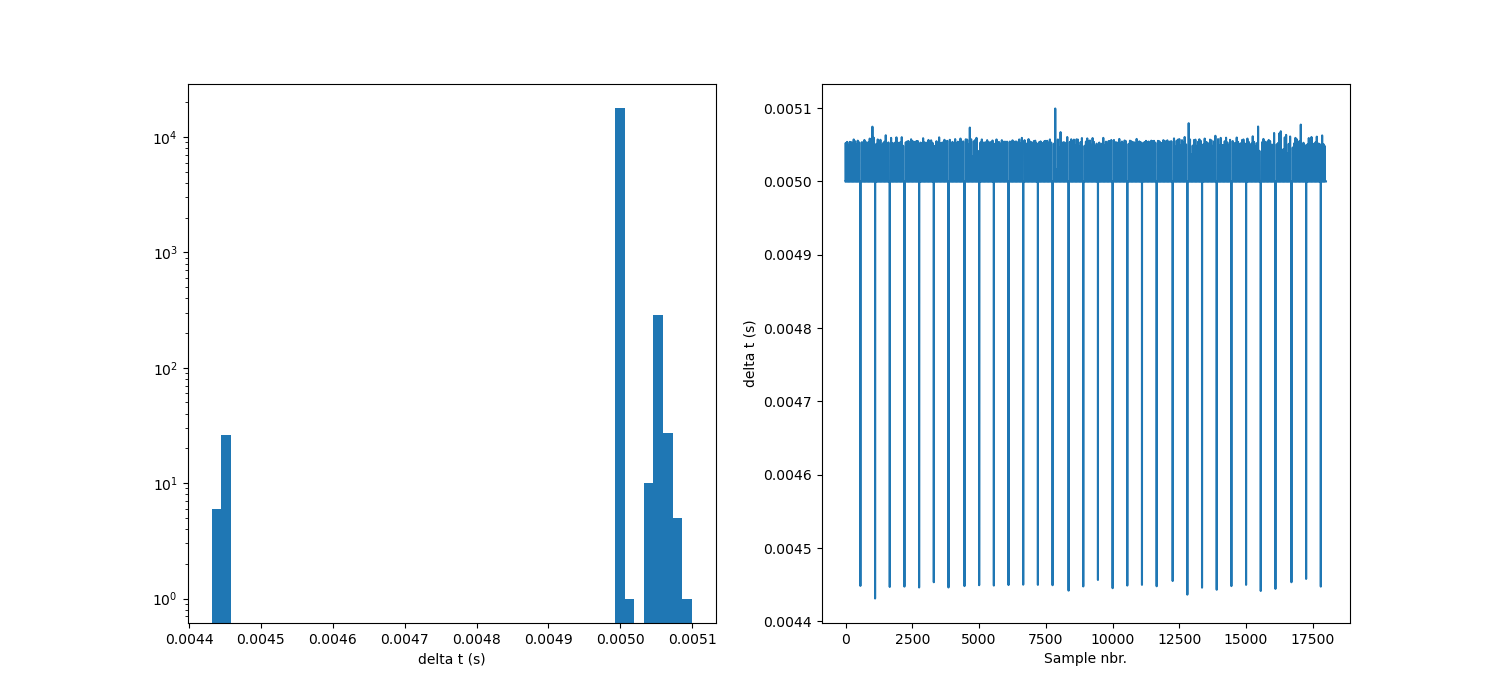
Fig. 1 Histogram of the time between consecutive samples (left) - Time between consecutive samples as a function of the sample number (right).#
First event All 100% vs off#
We compare the state with fans off (0%) and the state will all fans running at 100% for various sensors. In the first plot the quantity refered as the total acceleration correspond to the norm of the acceleration vector measured by the accelerometers.
Telemetry#
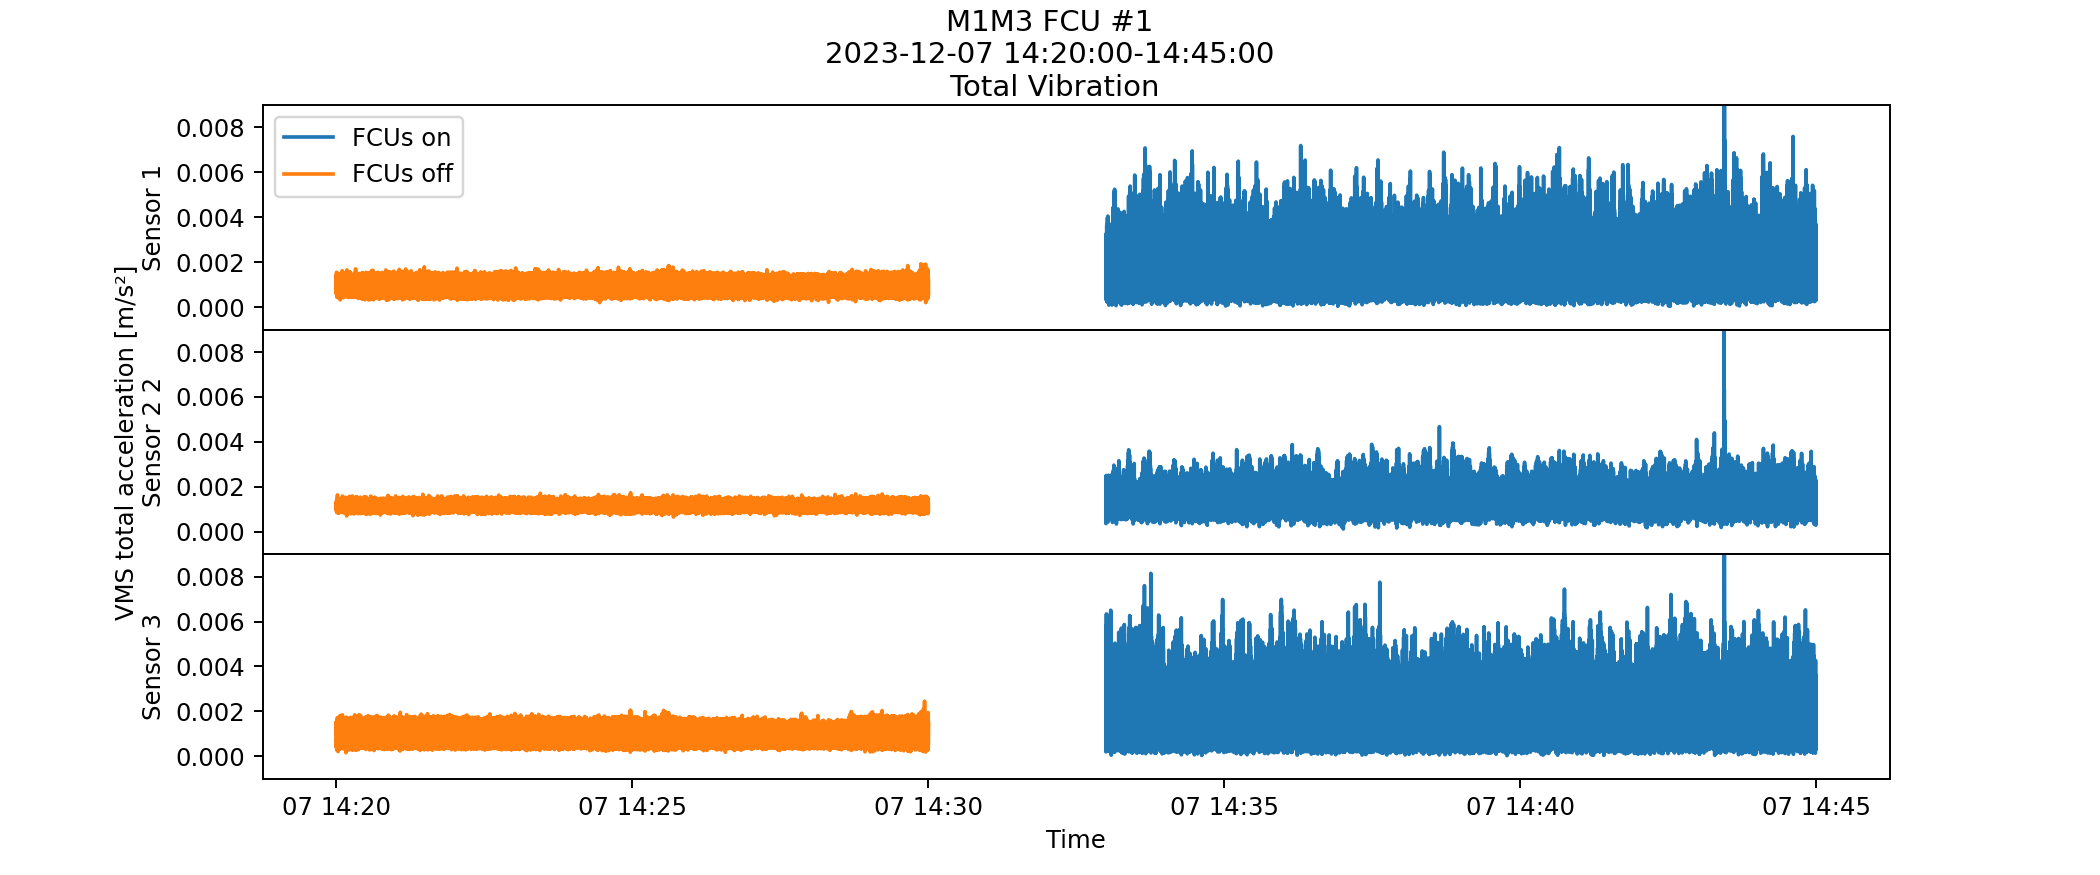
Fig. 2 VMS total acceleration (norm of the acceleration vector) for all FCUs at 100% (blue) and all off (orange).#
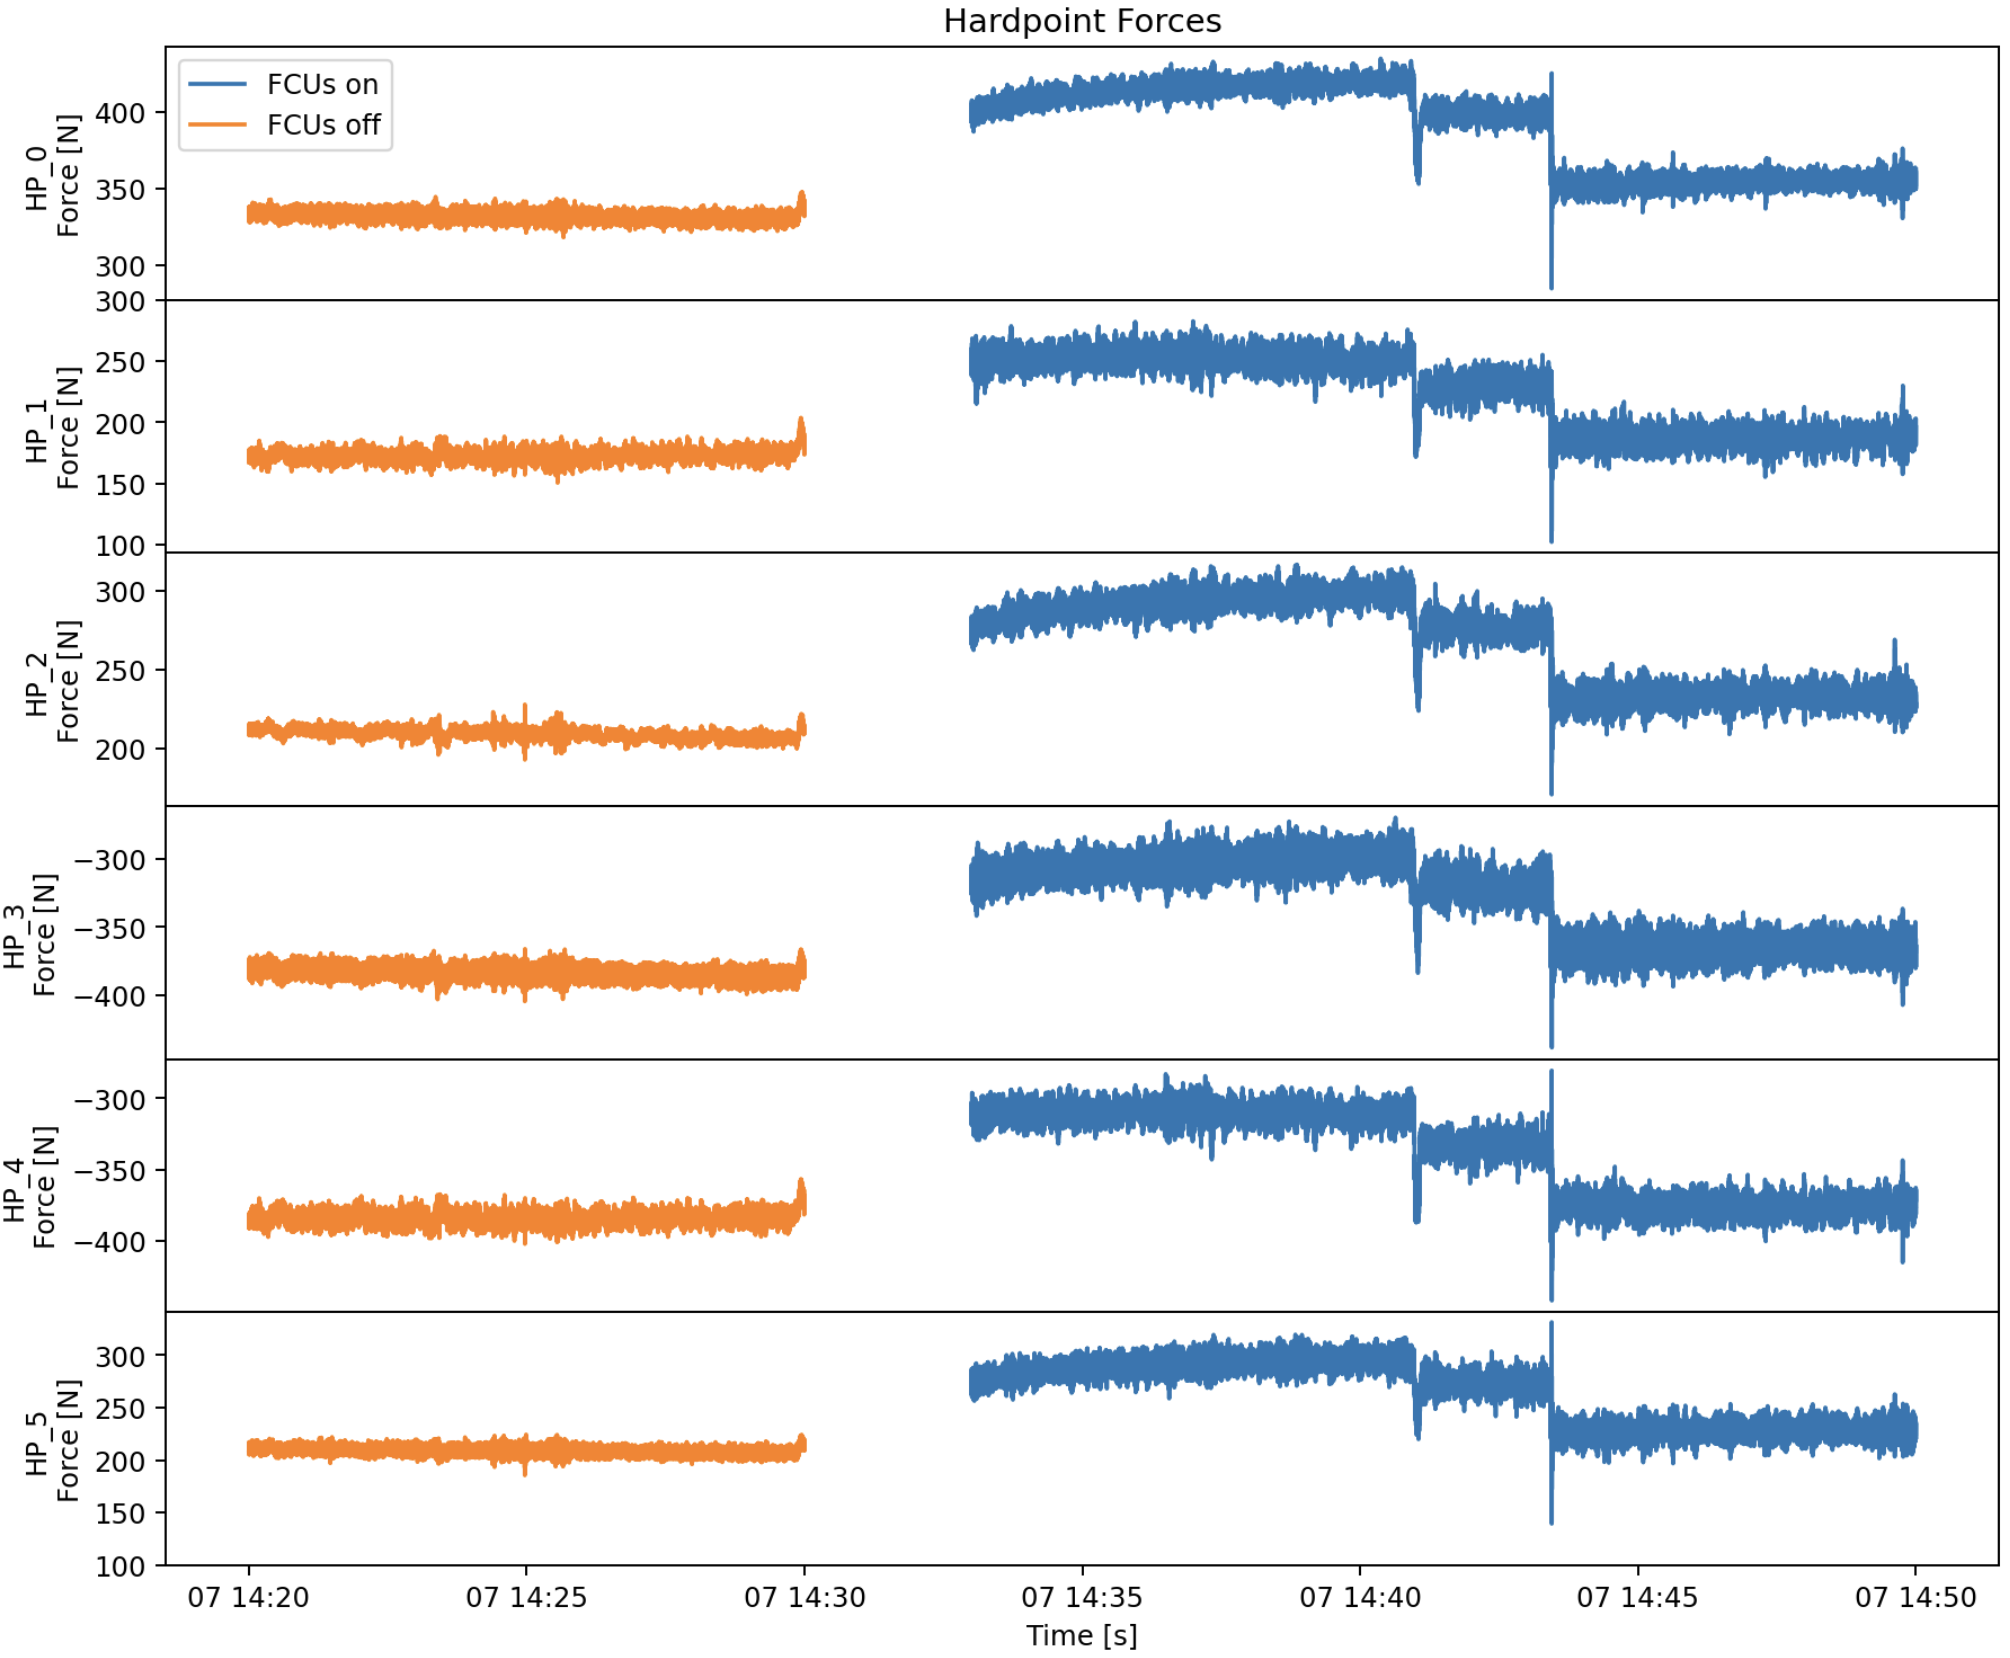
Fig. 3 Hardpoints forces for all FCUs at 100% (blue) and all off (orange).#
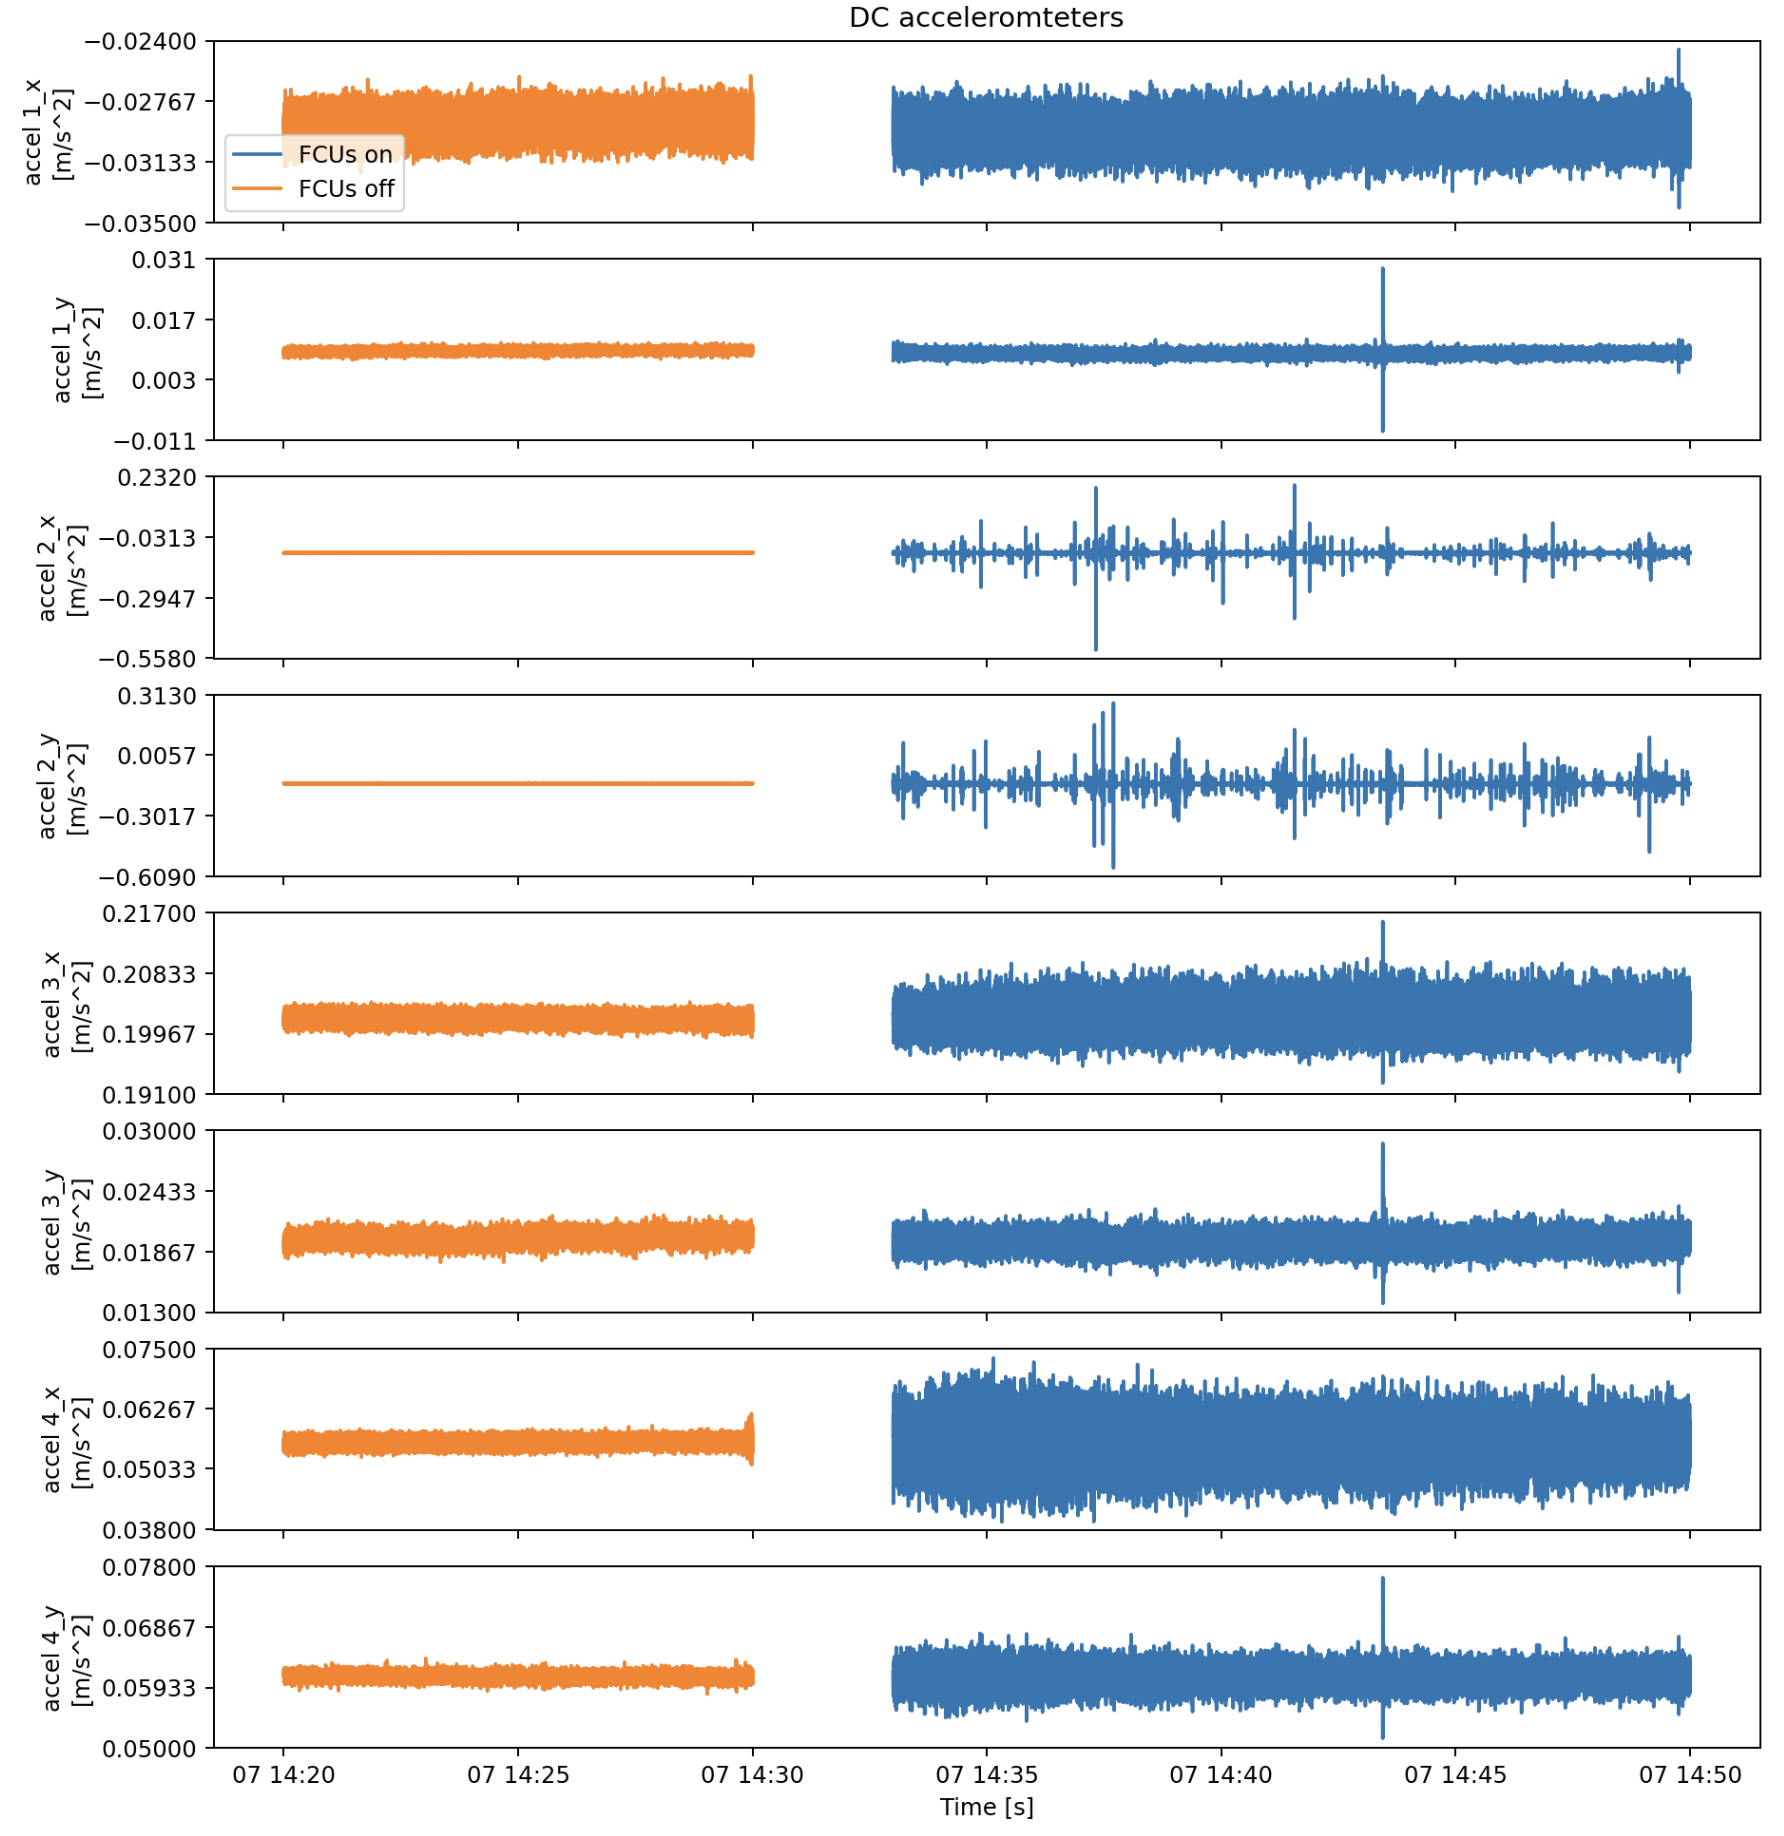
Fig. 4 Acceleration measured by dc accelerometers for all FCUs at 100% (blue) and all off (orange).#
From Figure 2 and 4 we see that the FCU running at 100% has a measurable effect on M1M3 as seen by the accelerometers (VMS or dc). It is unclear if the effect observed on Figure 3 (Hard points forces) is related to the FCU or to some other source.
Power Spectral Density (PSD) analysis#
We perform a PSD analysis on the datasets, cutting contributions from frequencies below 1 Hz. For clarity reasons and as we have multiple plots corresponding to the three sensors (accelerometers), each measuring the acceleration along 3 axes and for 11 values of the fan speed, we choose to show only a typical subset of plots in this section. The whole set of plots will be given in the appendix.
Acceleration#
In the following plot we show the PSD acceleration for sensor 3 - z axis and for every fan speed. We see that there is a narrow peak at about 38 Hz which is visible for almost every speed. As the peak is present when the fans are not running, it is clear that its origin is not related to the FCU.
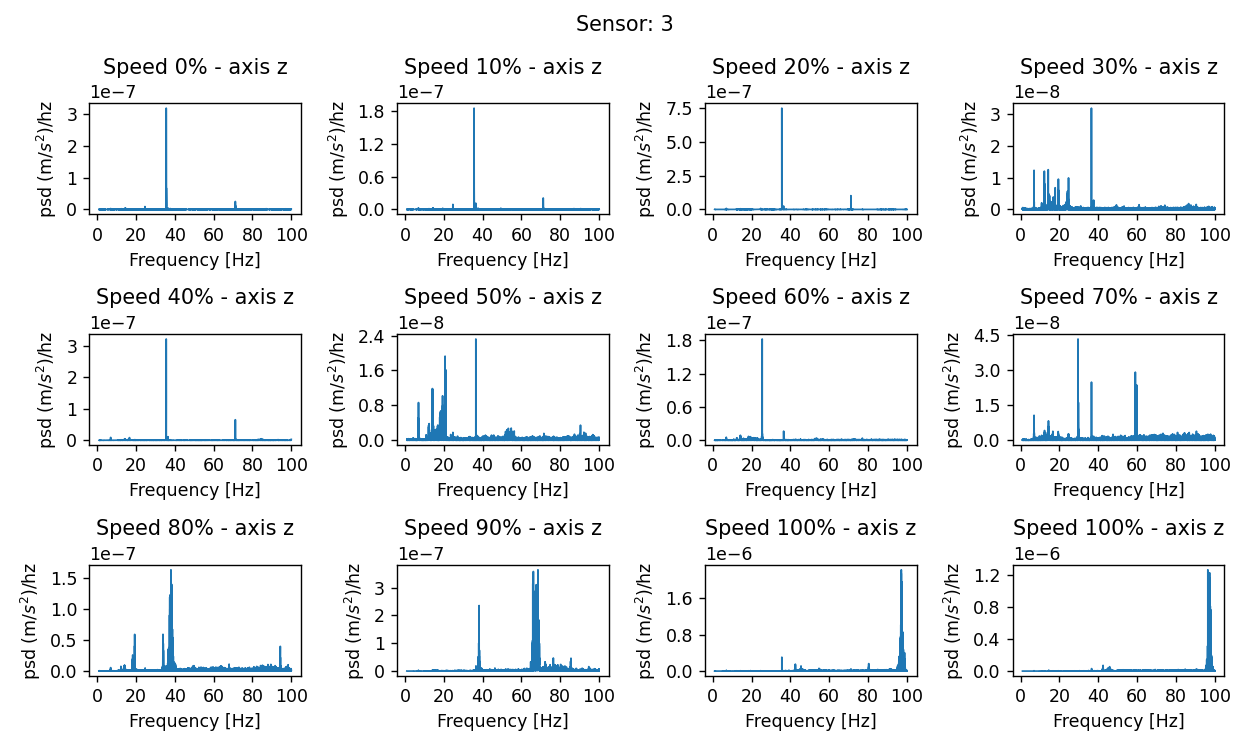
Fig. 5 PSD acceleration for sensor 3 - z axis and for every fan speed#
The only significant feature which is likely related to the fan speed is the broad peak which appears at 80% speed and which moves from ~40 Hz at 80%, ~65 Hz at 90% and up to ~98 Hz at 100% speed (notice that the peak at 98 Hz is present in both datasets acquired at 100% speed and taken more than 2 hours apart). The same behavior is observed in most of the cases (sensors and axes). The most pronounced effect is along the z axis.
For comparison we show the same plot but for sensor 1 and y axis.
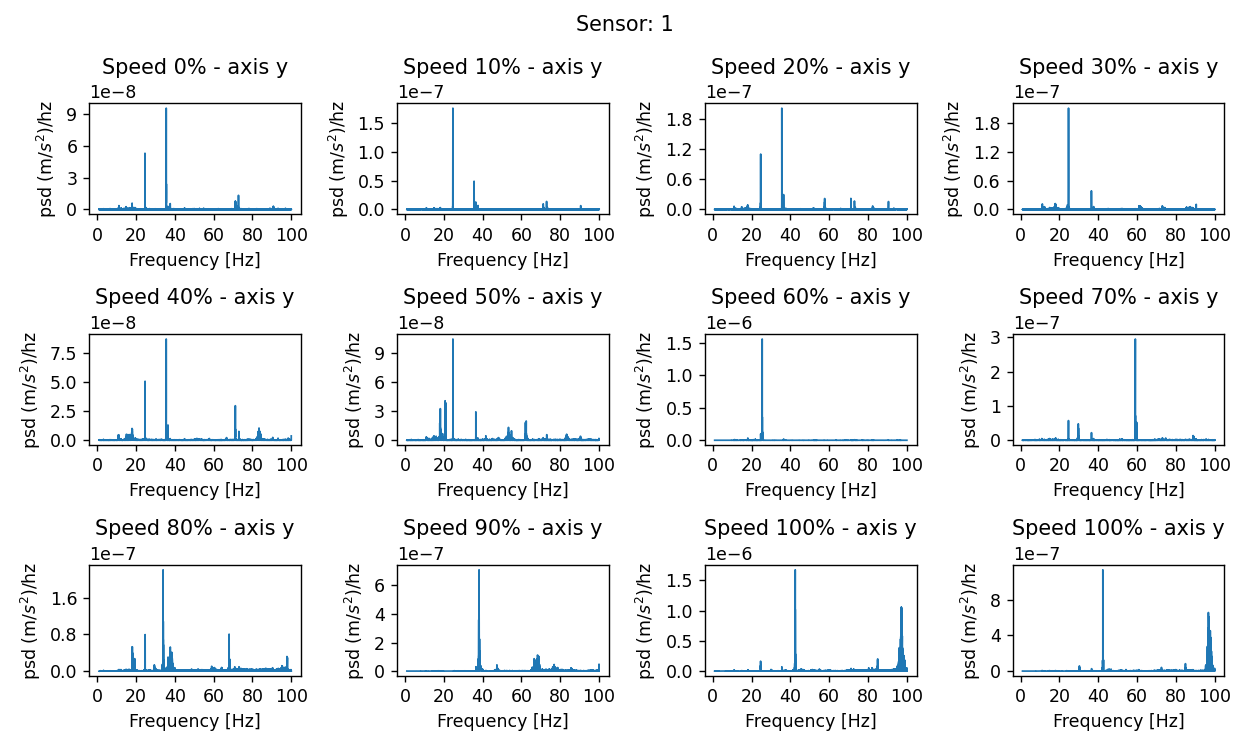
Fig. 6 PSD acceleration for sensor 1 - y axis and for every fan speed#
On this plot and for 100% speed we notice that there is also a large narrow peak ~42 Hz that could be related to the fan rotation speed (2550 rpm corresponds to 42 Hz).
The following plot is showing the PSD acceleration for a fan speed set at 80% and for the 3 sensors and the 3 axes.
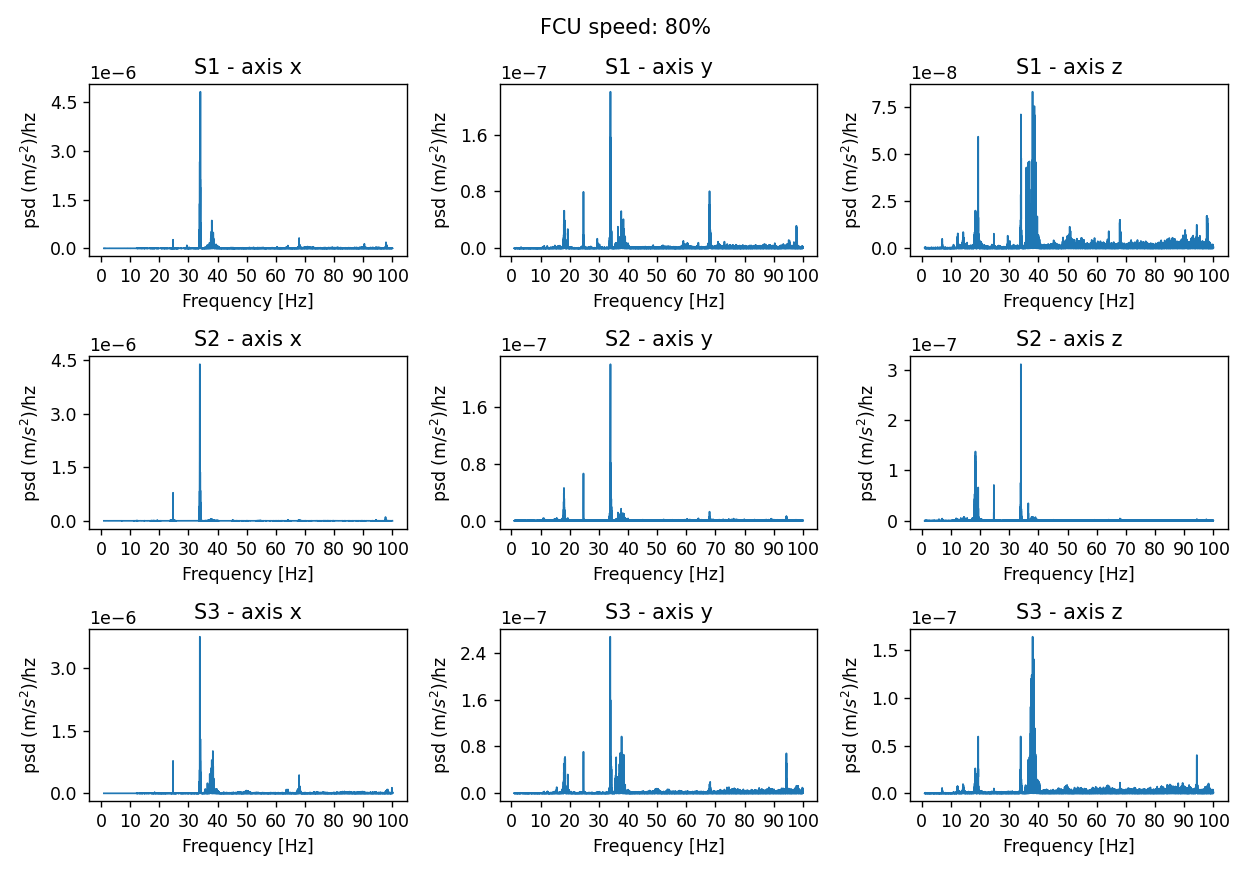
Fig. 7 PSD acceleration for a fan speed set at 80% and for the 3 sensors and the 3 axes#
The appearance of the broad peak around 40 Hz is clearly visible in all cases. The effect is nevertheless much less pronounced for Sensor 2.
Displacement#
The following plot shows the cumulative displacement computed for Sensor 1 and x axis:

Fig. 8 Cumulative displacement for Sensor 1 and x axis#
As expected the highest contributions to the displacement is coming from the low frequencies. The effect of the FCU on the displacement is only noticeable for the first dataset with fans running at 100% speed. This effect is not visible in the second 100% speed dataset (which is much shorter). The same behavior is observable for all the sensors and all the axes.
Conclusions#
From this study we conclude that we see an effect of the FCU when running at 100% speed. The PSD analysis exhibits a broad peak in the spectrum for speeds larger than 80% of the maximium speed. The contribution of this peak to the mirror displacement is negligeable at all speeds and the only sigificant contribution to the displacement is seen at 100% speed, probably coming from the lower frequencies.
The significance of this analysis is limited by the size of the dataset and the fact that we only have one set of measurements per speed (2 for 100%). It is difficult to disentangle the effect of contributions external to the FCU.
The measurements will have to be repeated when the glass mirror is in place.
Appendix#
In this appendix we put all the plots corresponding to the PSD analysis for the 3 sensors and the 3 axes.
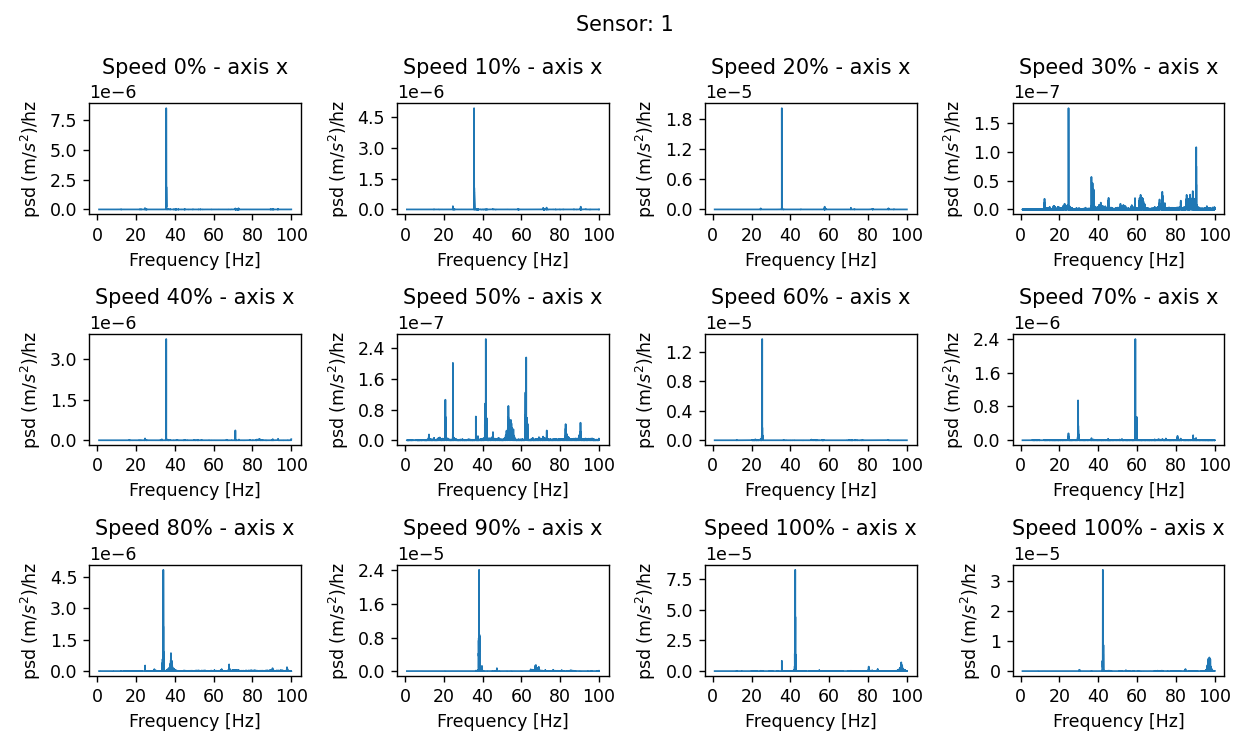
Fig. 9 PSD acceleration for sensor 1 - x axis and for every fan speed#
Fig. 10 PSD acceleration for sensor 1 - y axis and for every fan speed#
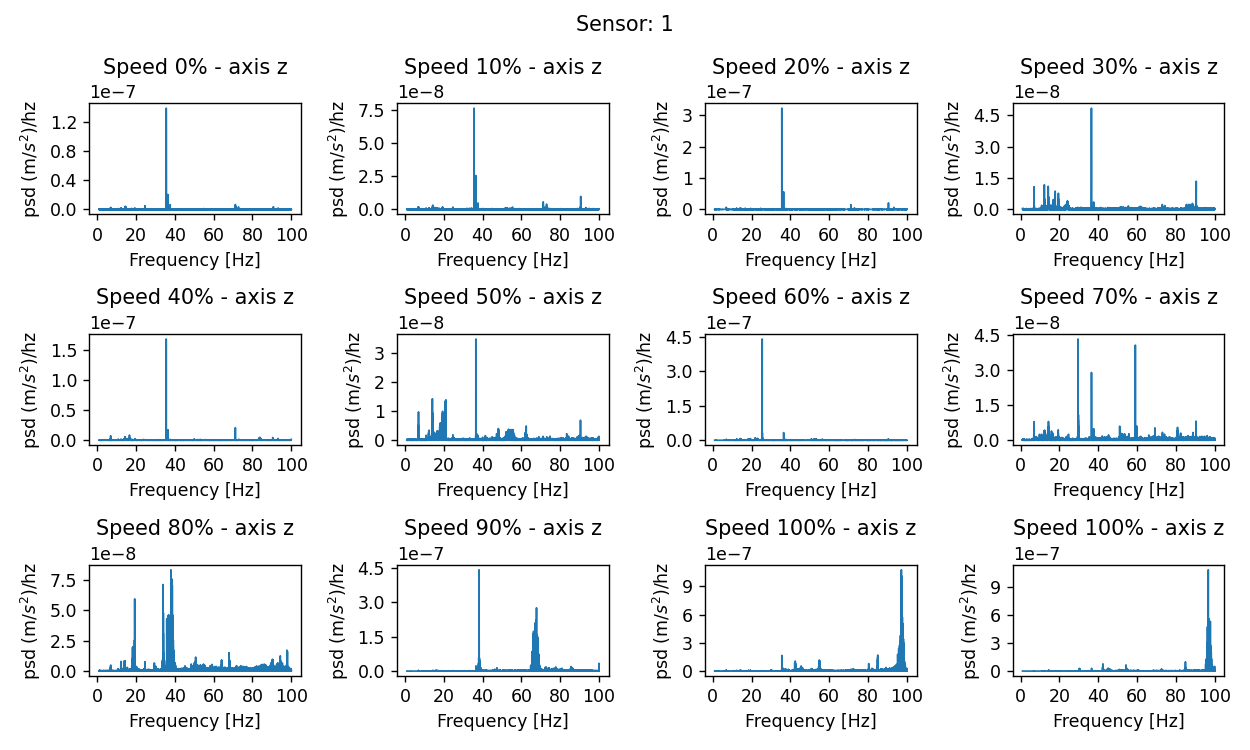
Fig. 11 PSD acceleration for sensor 1 - z axis and for every fan speed#
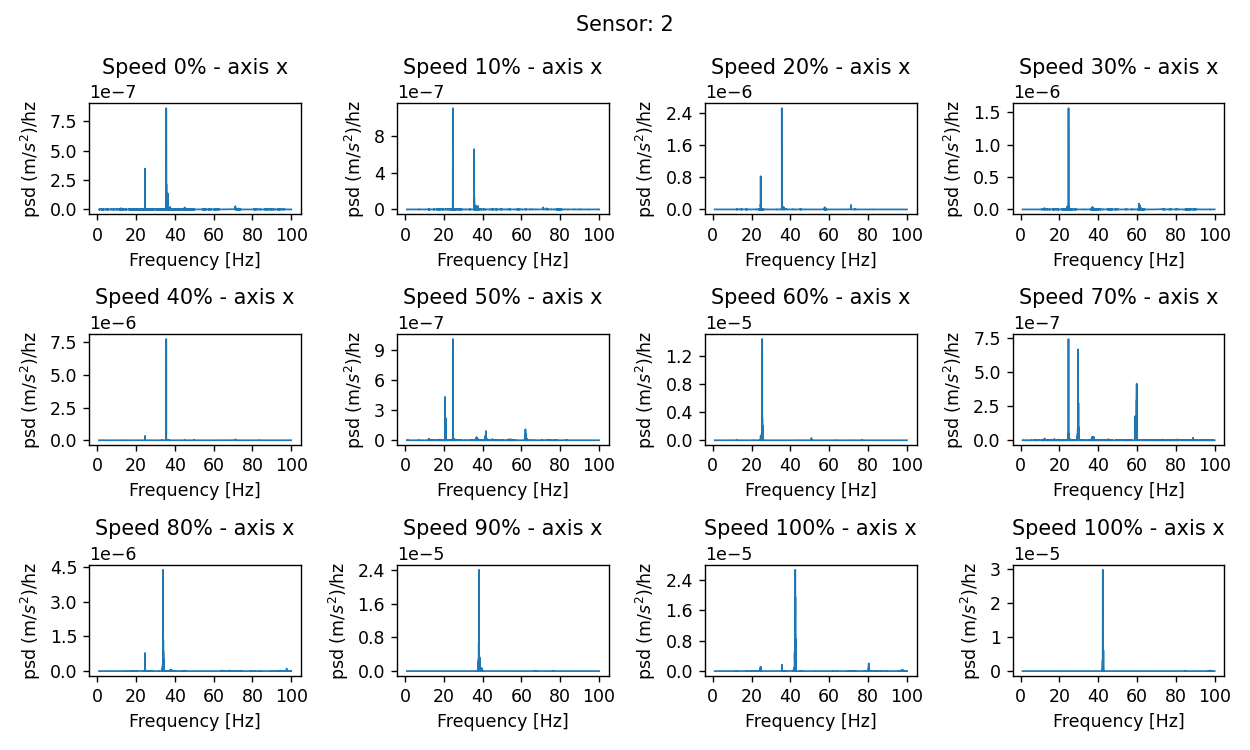
Fig. 12 PSD acceleration for sensor 2 - x axis and for every fan speed#
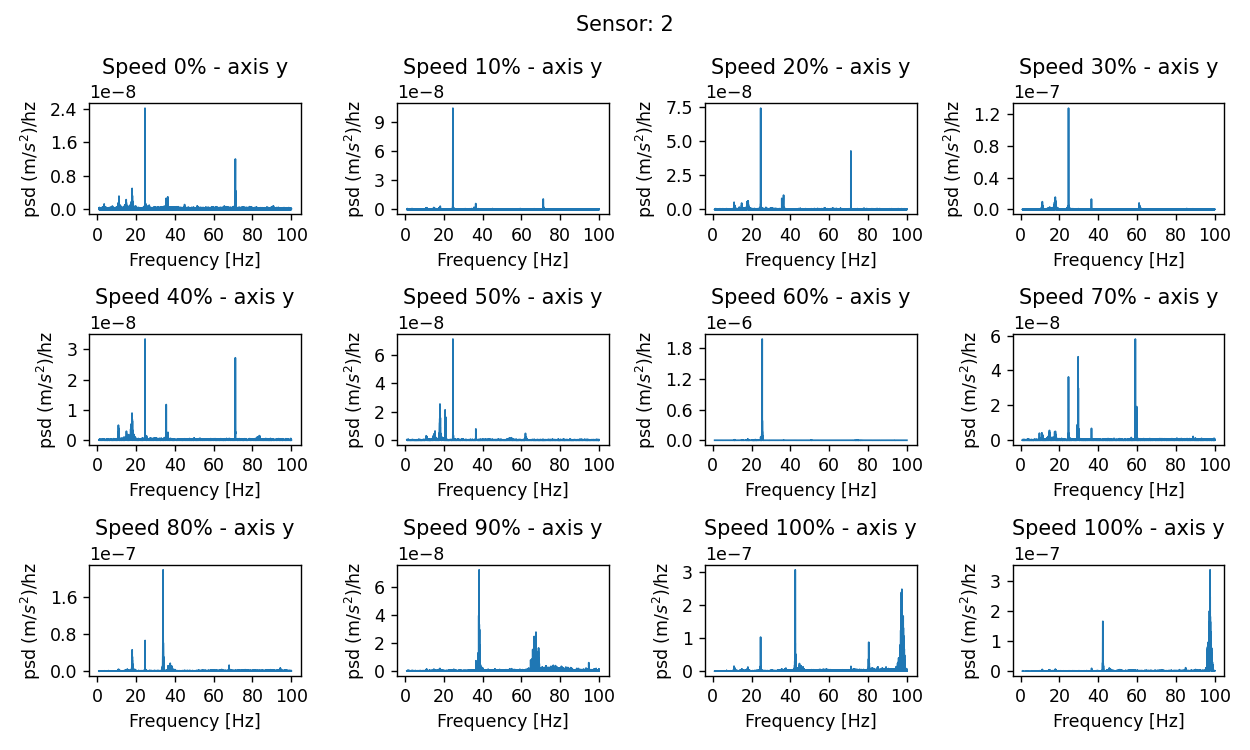
Fig. 13 PSD acceleration for sensor 2 - z axis and for every fan speed#
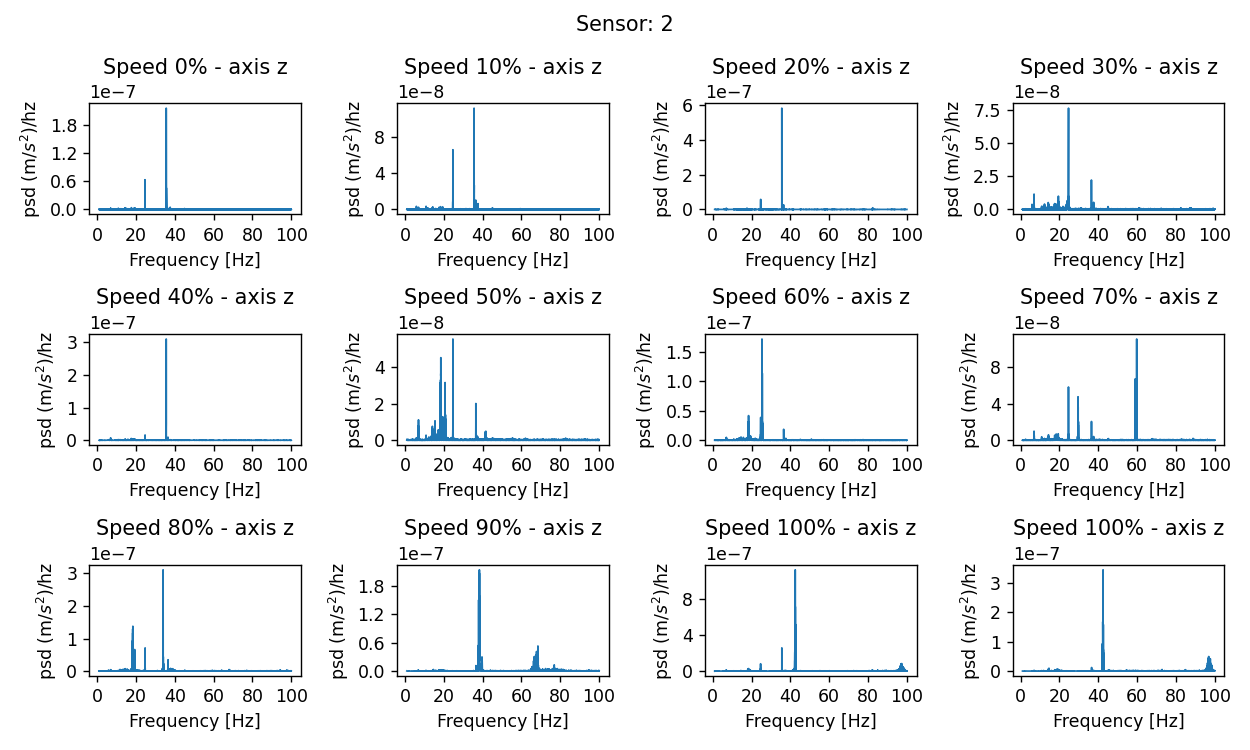
Fig. 14 PSD acceleration for sensor 2 - z axis and for every fan speed#
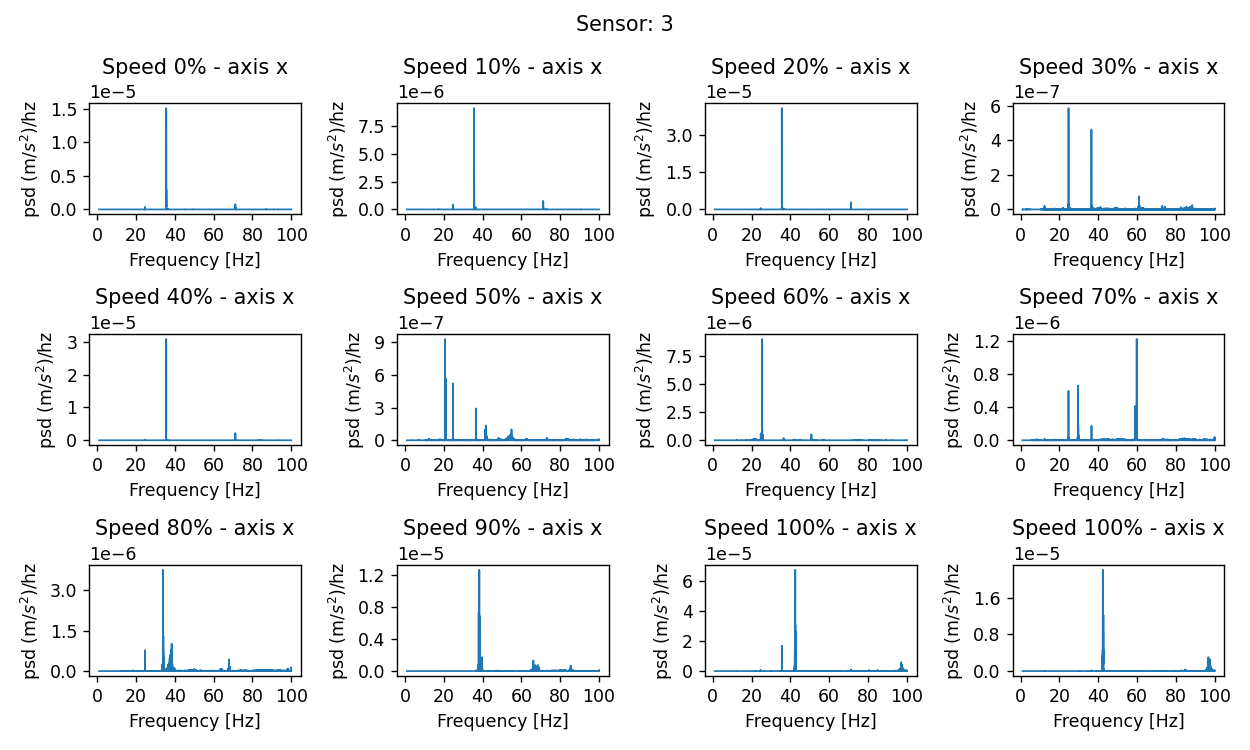
Fig. 15 PSD acceleration for sensor 3 - x axis and for every fan speed#
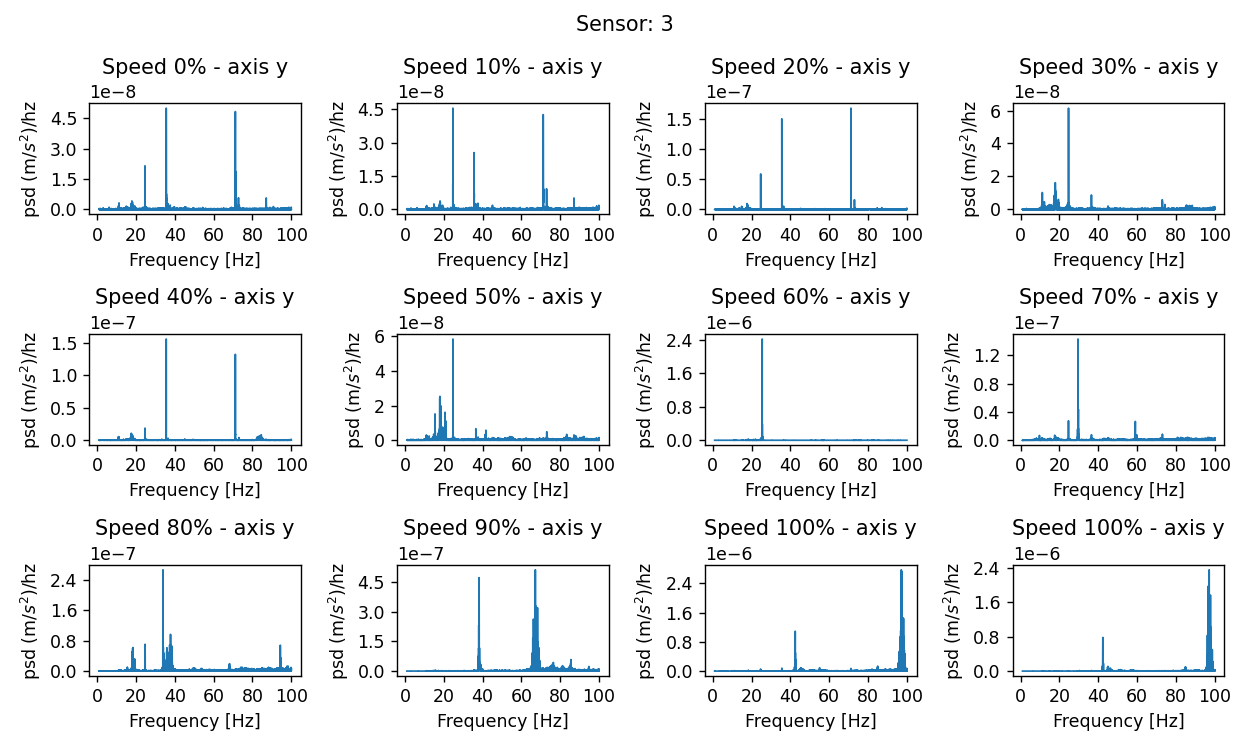
Fig. 16 PSD acceleration for sensor 3 - y axis and for every fan speed#
Fig. 17 PSD acceleration for sensor 3 - z axis and for every fan speed#
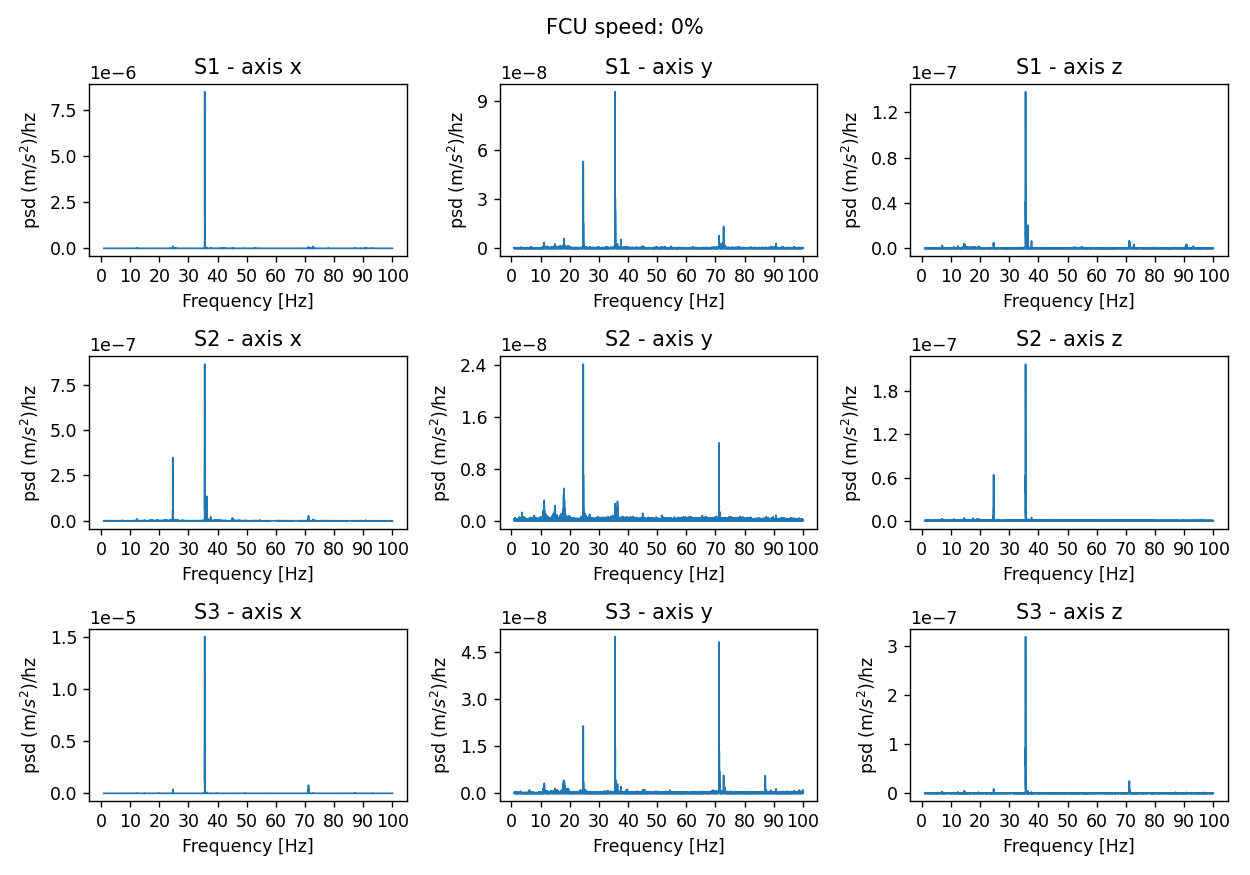
Fig. 18 PSD acceleration for a fan speed set at 0% and for the 3 sensors and the 3 axes#
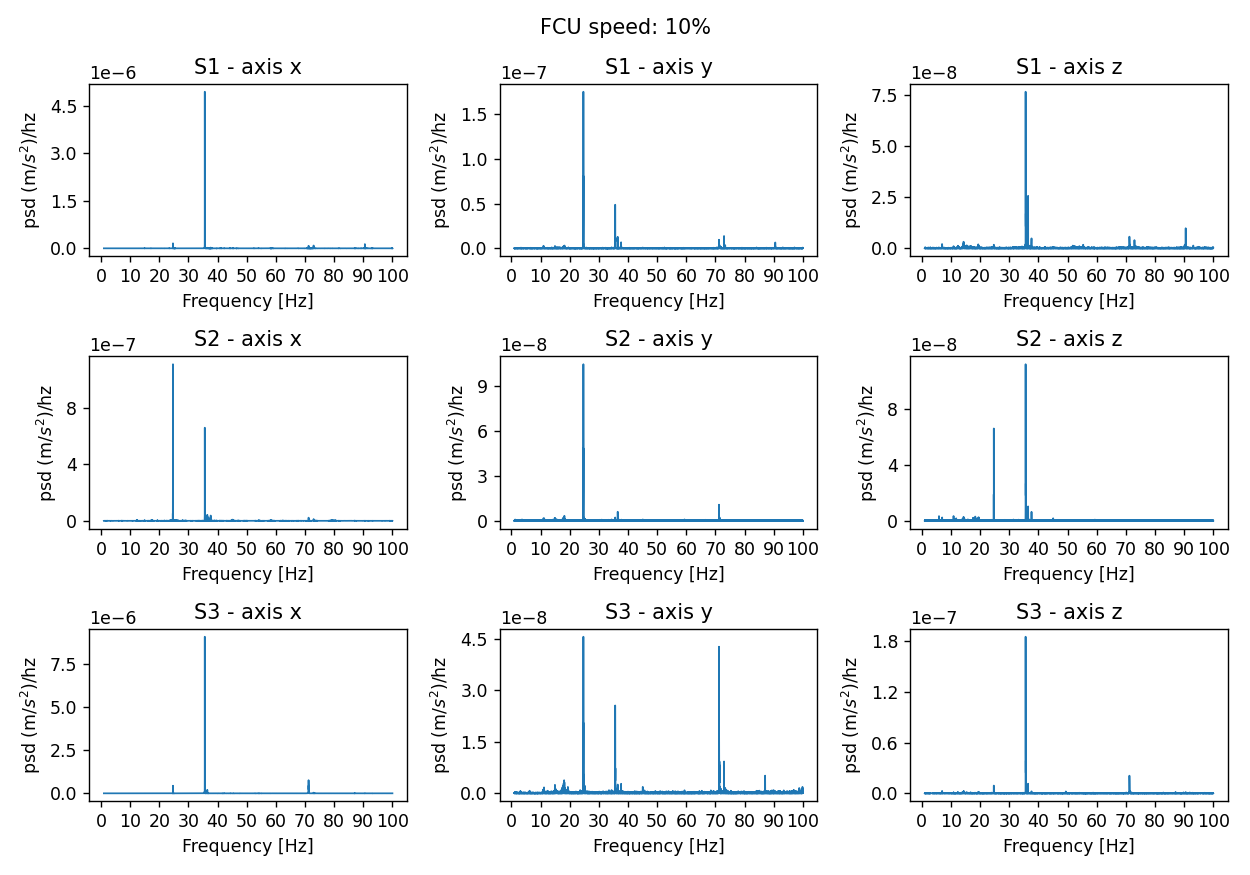
Fig. 19 PSD acceleration for a fan speed set at 10% and for the 3 sensors and the 3 axes#
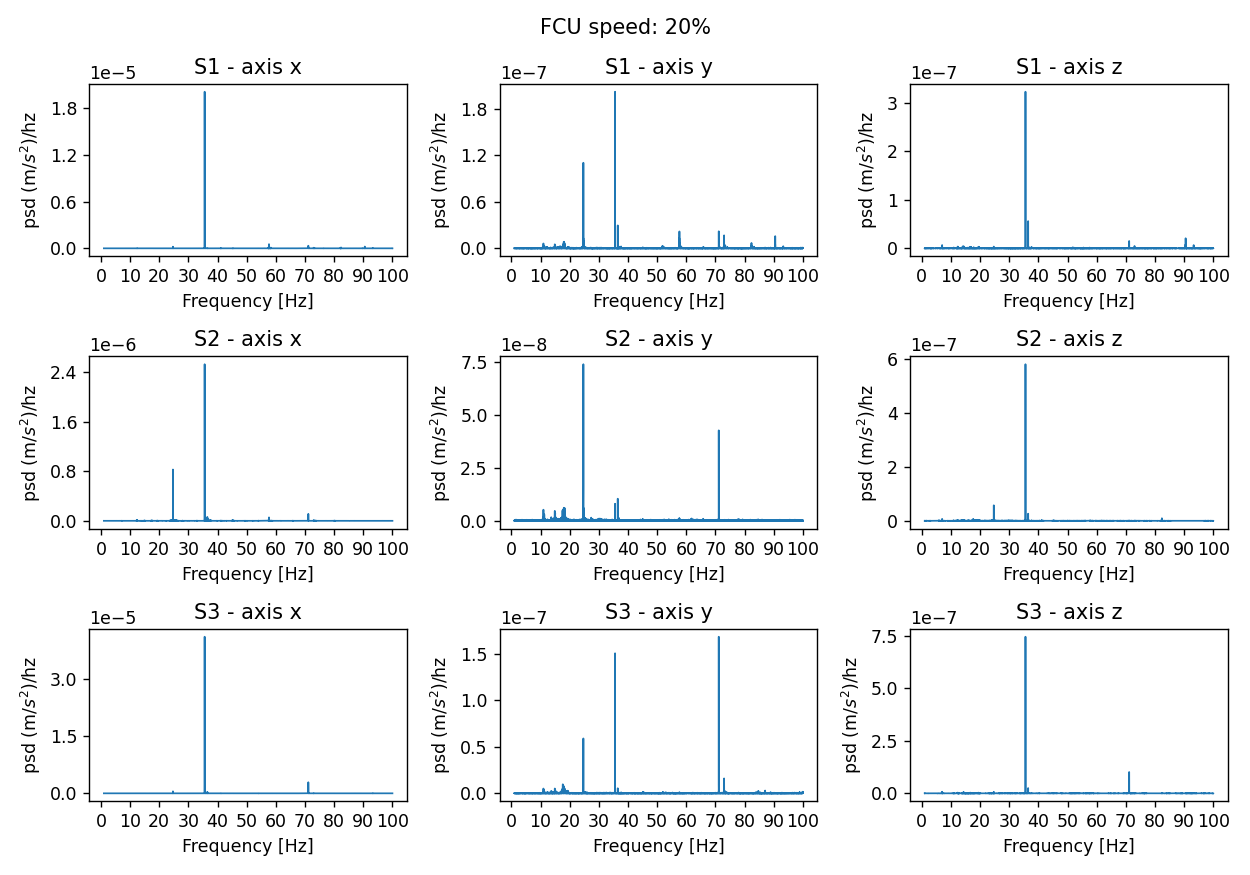
Fig. 20 PSD acceleration for a fan speed set at 20% and for the 3 sensors and the 3 axes#
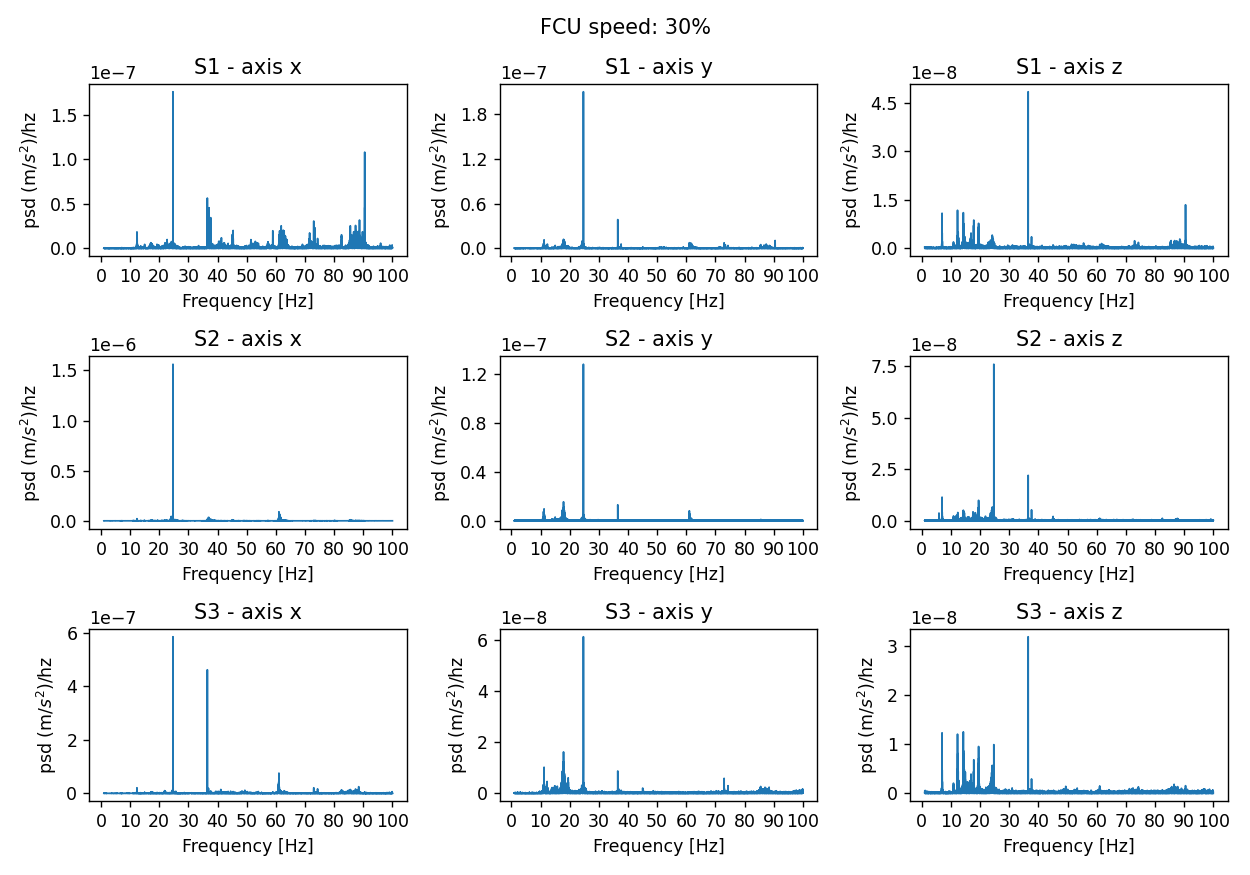
Fig. 21 PSD acceleration for a fan speed set at 30% and for the 3 sensors and the 3 axes#
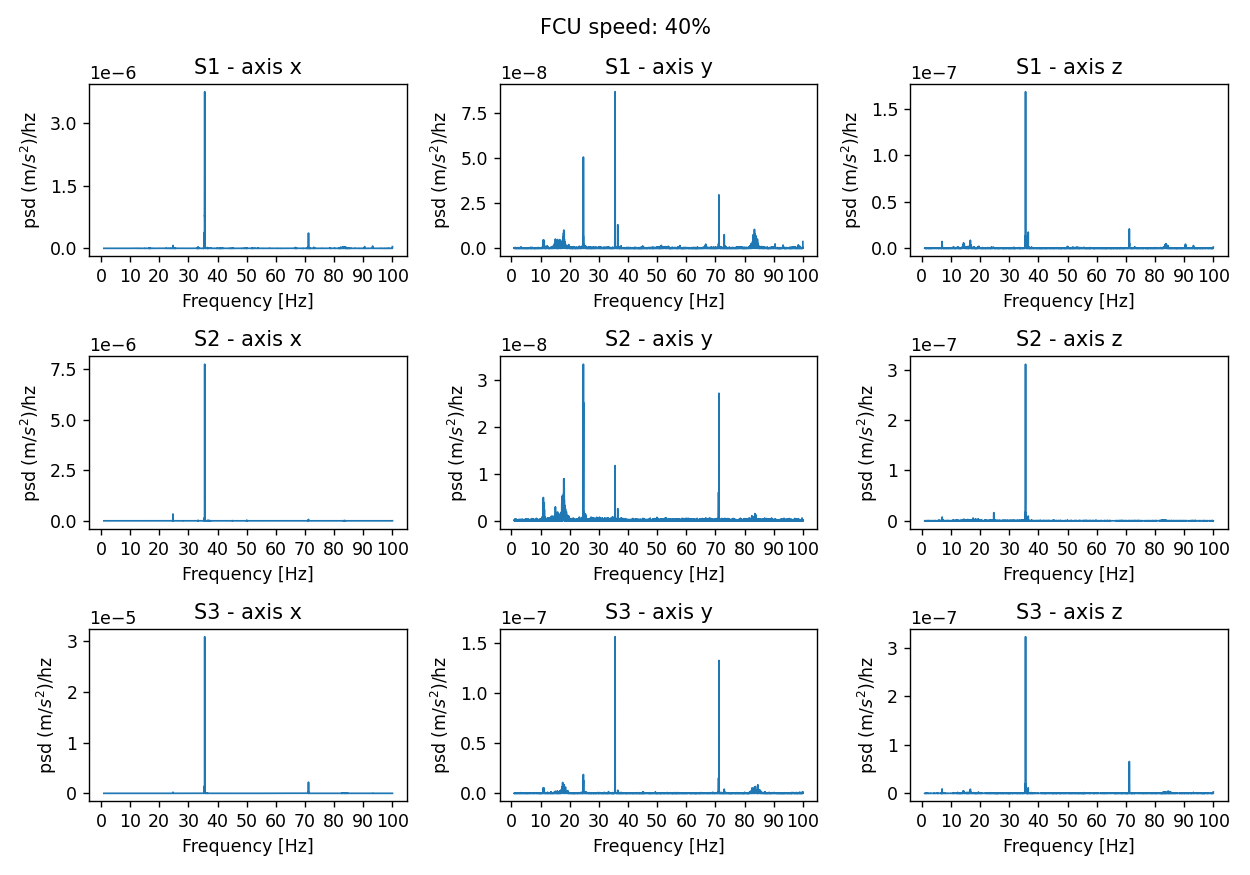
Fig. 22 PSD acceleration for a fan speed set at 40% and for the 3 sensors and the 3 axes#
Fig. 23 PSD acceleration for a fan speed set at 60% and for the 3 sensors and the 3 axes#
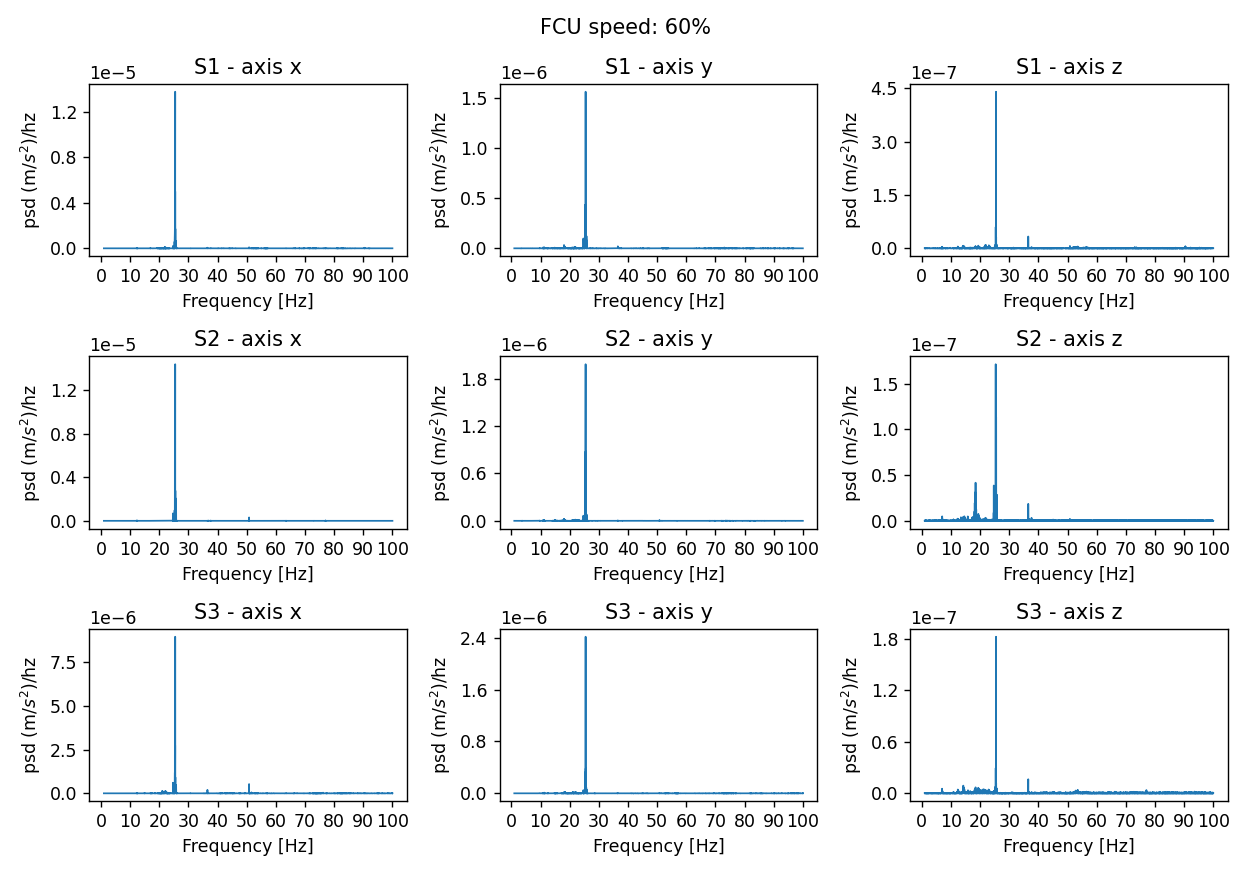
Fig. 24 PSD acceleration for a fan speed set at 60% and for the 3 sensors and the 3 axes#
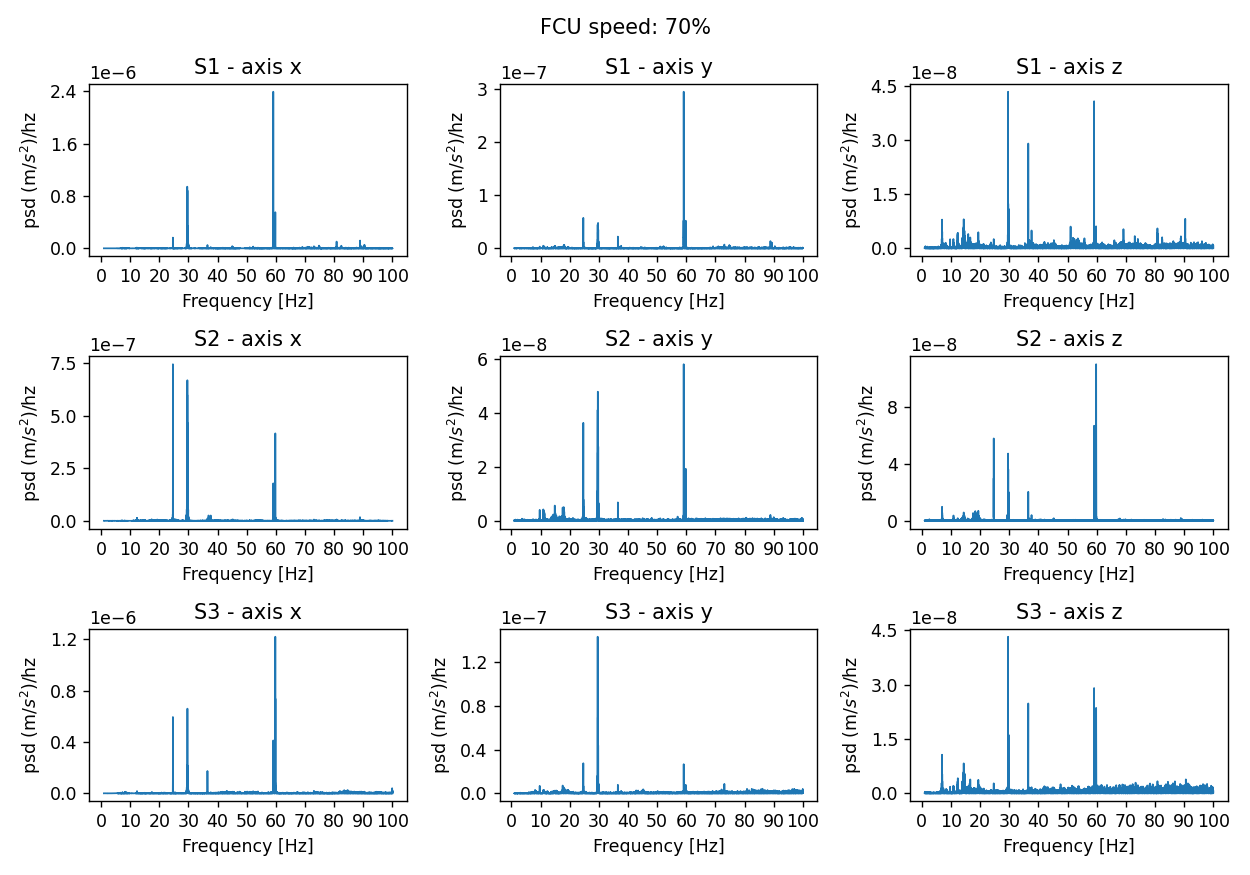
Fig. 25 PSD acceleration for a fan speed set at 70% and for the 3 sensors and the 3 axes#

Fig. 26 PSD acceleration for a fan speed set at 80% and for the 3 sensors and the 3 axes#
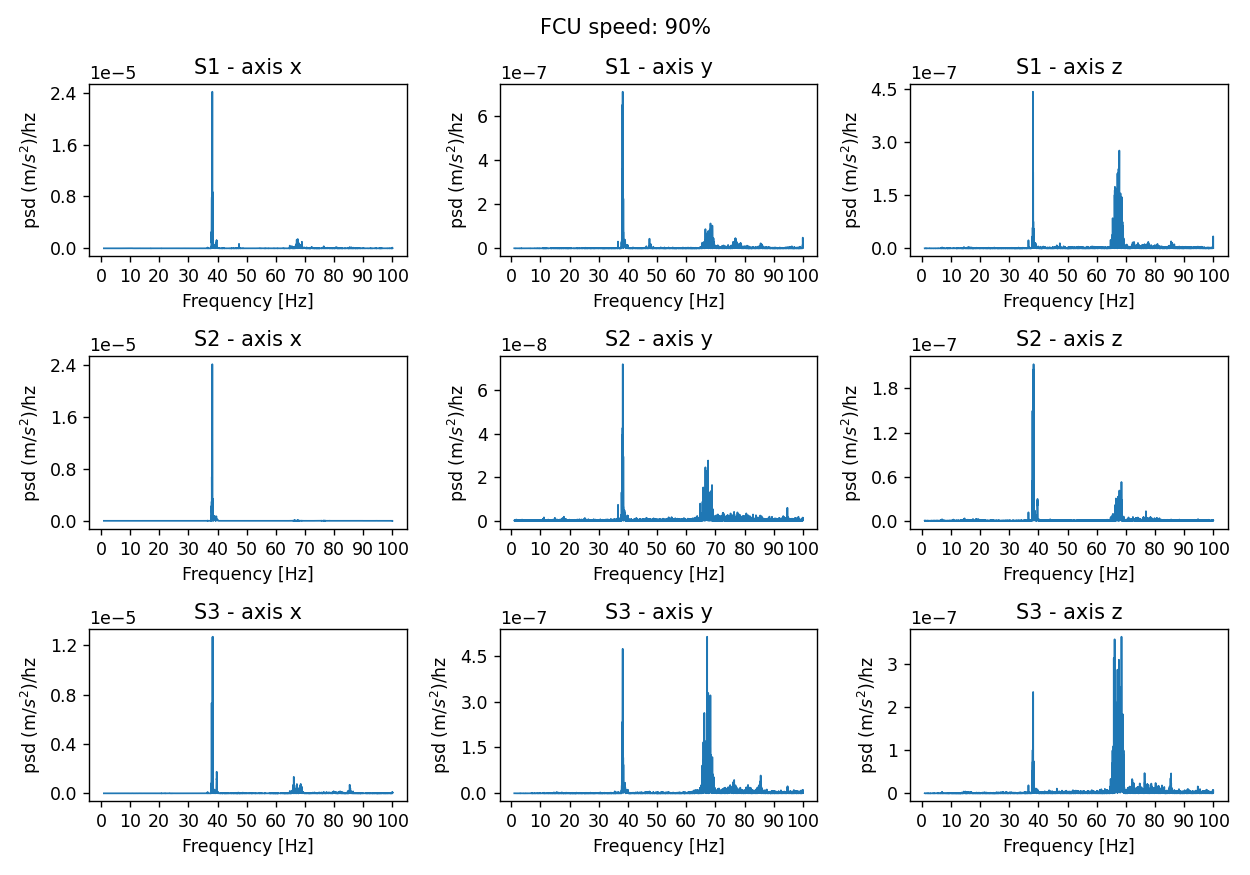
Fig. 27 PSD acceleration for a fan speed set at 90% and for the 3 sensors and the 3 axes#
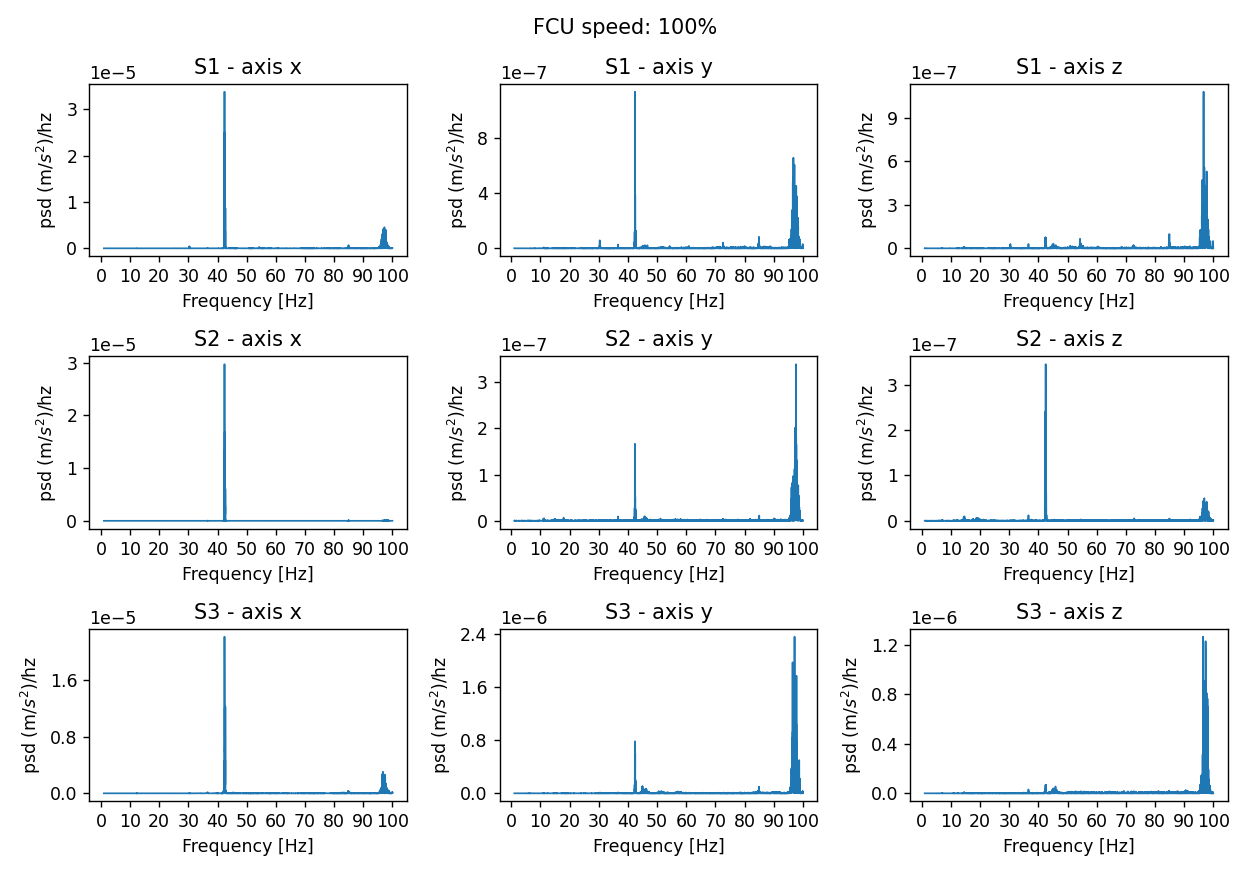
Fig. 28 PSD acceleration for a fan speed set at 100% and for the 3 sensors and the 3 axes#
Fig. 29 Cumulative displacement for Sensor 1 and x axis#

Fig. 30 Cumulative displacement for Sensor 1 and y axis#

Fig. 31 Cumulative displacement for Sensor 1 and z axis#

Fig. 32 Cumulative displacement for Sensor 2 and x axis#

Fig. 33 Cumulative displacement for Sensor 2 and y axis#

Fig. 34 Cumulative displacement for Sensor 2 and z axis#

Fig. 35 Cumulative displacement for Sensor 3 and x axis#

Fig. 36 Cumulative displacement for Sensor 3 and y axis#

Fig. 37 Cumulative displacement for Sensor 3 and z axis#